Project Description
Invesco
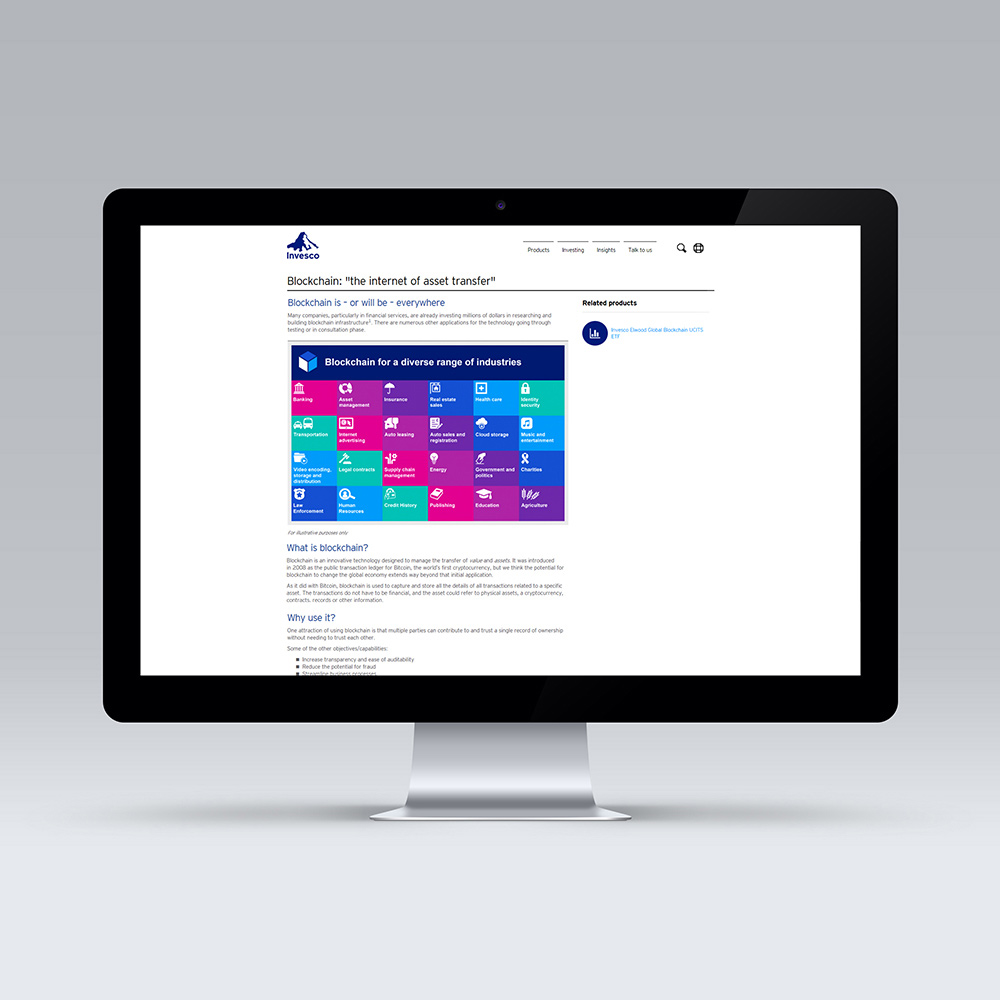
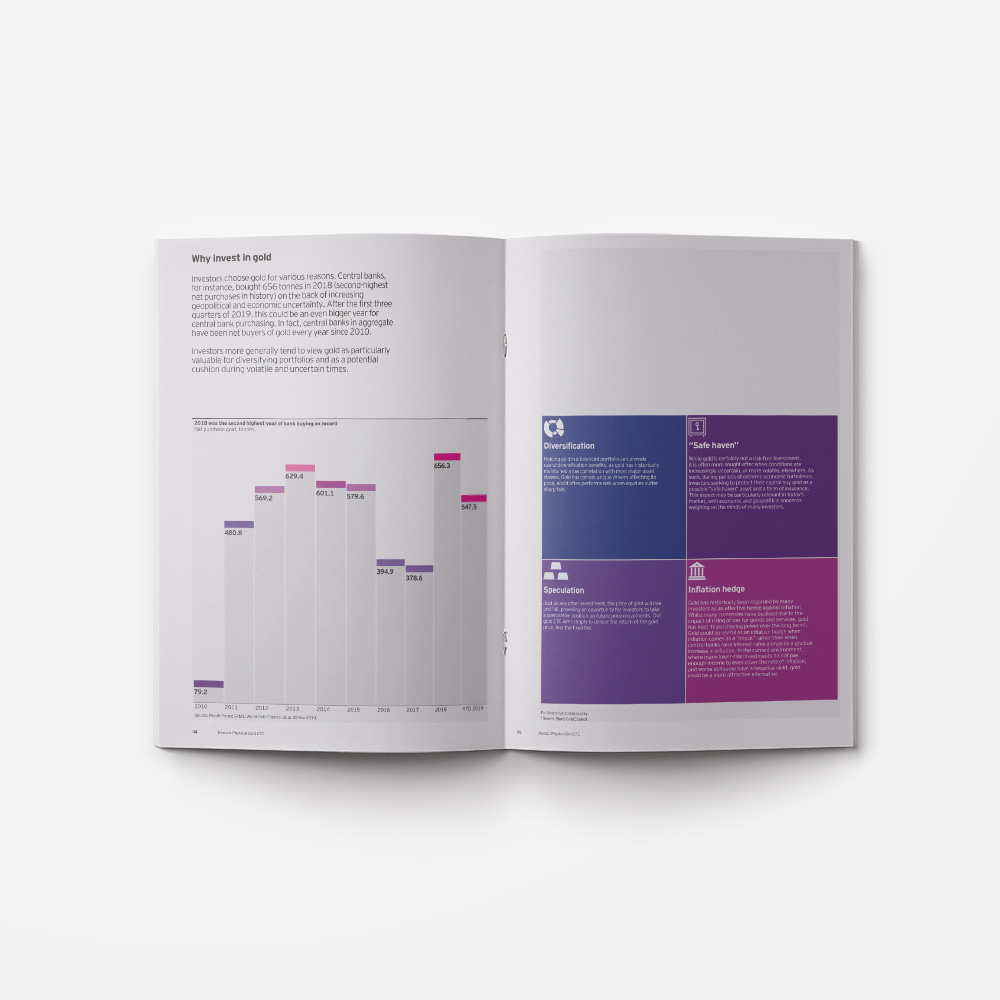
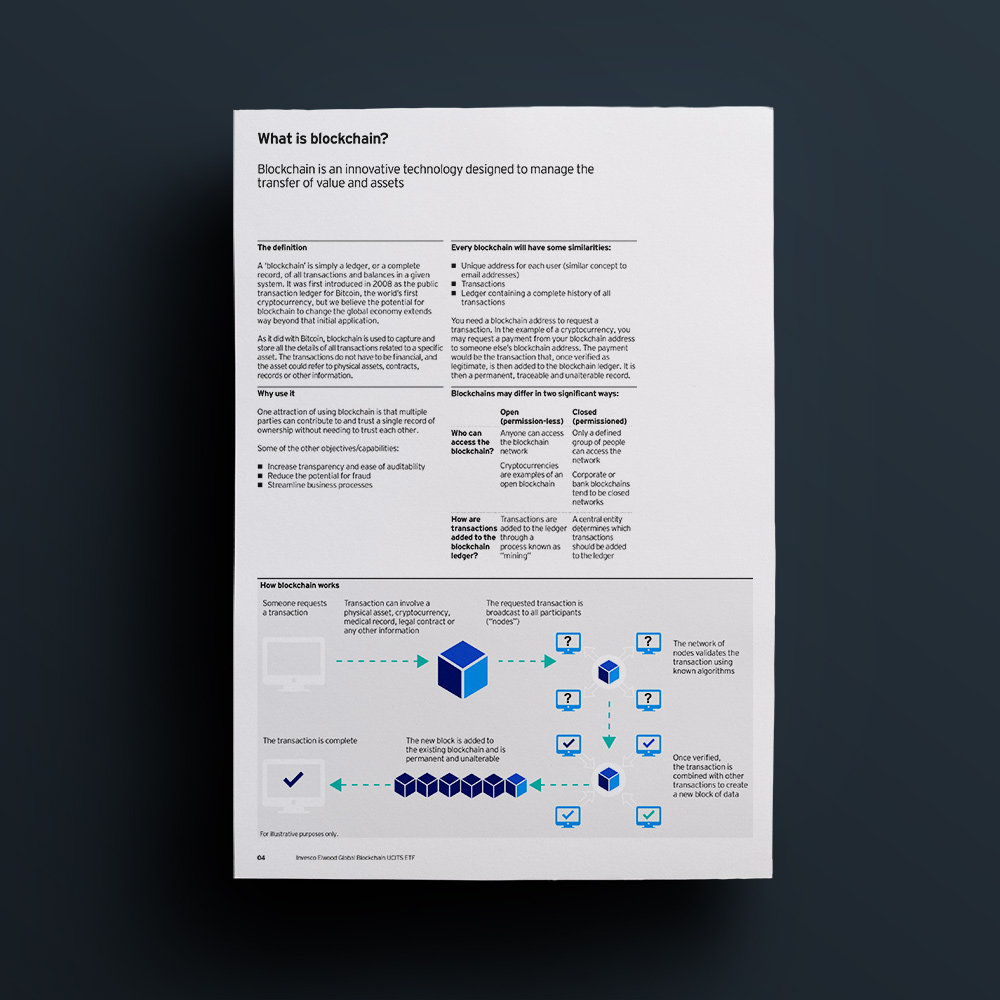
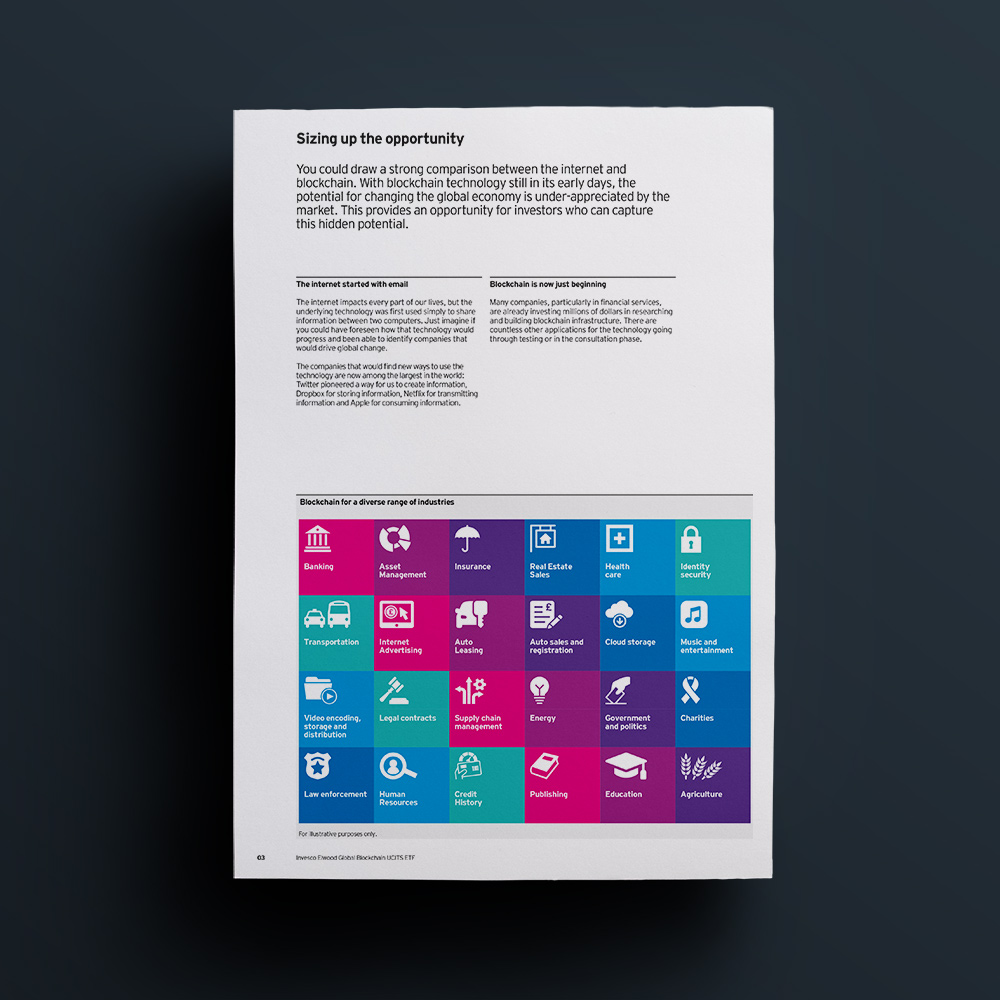
Data visualisation and infographics
Following the Invesco style, the team create a range of data illustrations on a daily basis for the business teams. These range from high-level conceptual graphics to the daily data charts and graphs. The aim is always to present the data in a clear, professional and attractive form.